Machine Learning aided Epidemiology: COVID-19 Global quarantine strength and Covid spread parameter evolution
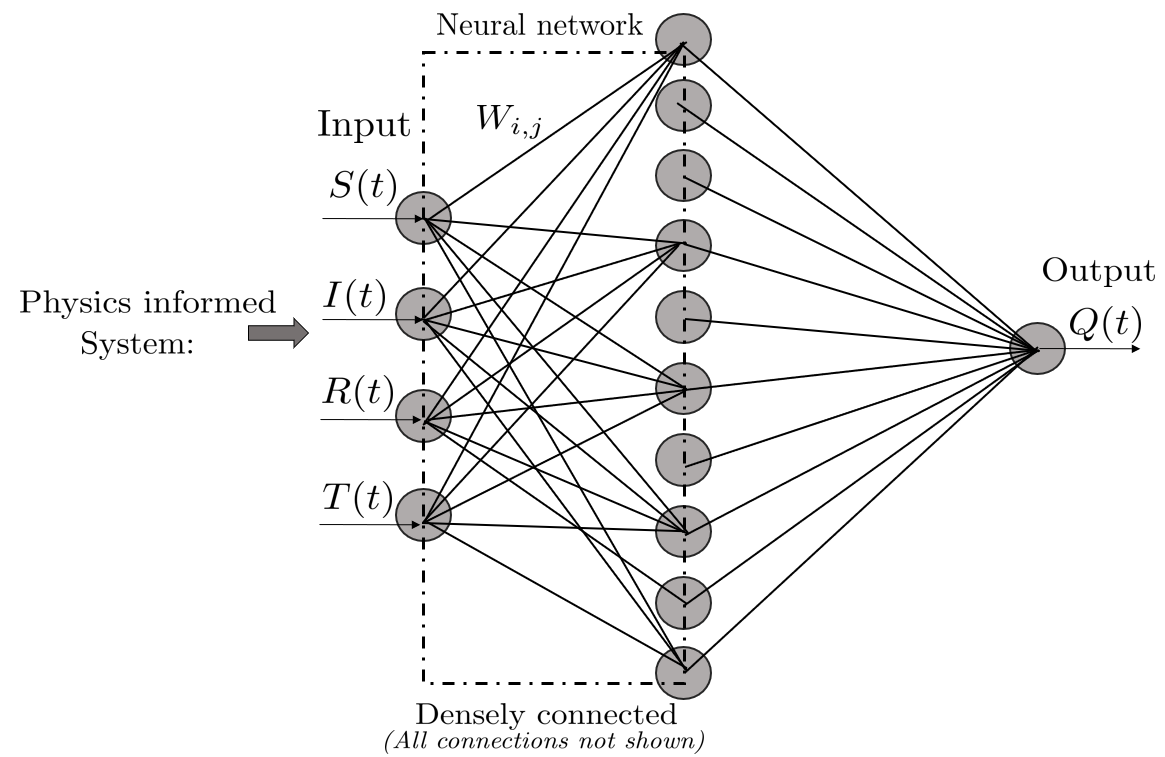
The quarantine strength function and the effective reproduction variation in several countries is estimated. The method followed is based on augmentation of the standard SIR epidemiological model with machine learning. Our model is universally applicable making it a flexible and powerful tool to analyze and compare the efficacy of government measures in curtailing virus spread in different countries.

Europe
France
Germany
Belgium
Norway
Denmark
Turkey
Sweden
Serbia
Czech Republic
Russia
Spain
Italy
UK
Moldova
North Macedonia
Belarus
Ukraine
Netherlands
Portugal
Poland
Romania
Switzerland
Ireland
Asia
India
South Korea
China
Philippines
Iran
Pakistan
Saudi Arabia
Bangladesh
Qatar
Iraq
Kazakhstan
Kuwait
Israel
Japan
Singapore
Malaysia
Afghanistan
Bahrain
Oman
Armenia
North America
South America
Africa
Oceania
Clickable World Map
The regions for which our code is applied currently is shown in the above boxes. Alternatively, these regions can also be clicked on the map below to visualize the results.
Code and Data
The basic code is uploaded here. The code uses the method of universal ODE's developed here.
Data is collected from Center for Systems Science and Engineering (CSSE) at Johns Hopkins University.